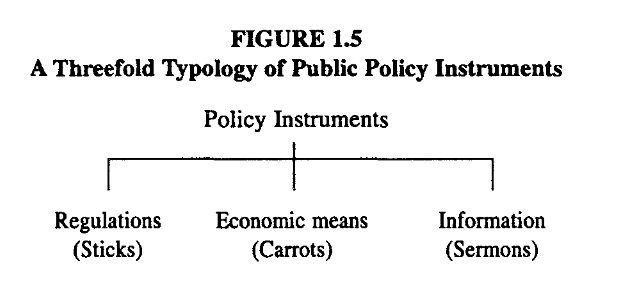
Vedung, E. (1998). Policy instruments: Typologies and theories. In M. L. Bemelmans-Videc, R. C. Rist, & E. Vedung (Eds.), Carrots, sticks, and sermons: Policy instruments and their evaluation (pp. 21–58). Transaction Publishers.
Personal website – any views expressed herein are my own unless otherwise obvious
Vedung, E. (1998). Policy instruments: Typologies and theories. In M. L. Bemelmans-Videc, R. C. Rist, & E. Vedung (Eds.), Carrots, sticks, and sermons: Policy instruments and their evaluation (pp. 21–58). Transaction Publishers.
Great blog post, by the always insightful Julia Rohrer
“The starting point of this paper was a 2 × 2 DiD design that researchers have been using for almost 200 years. The end point was a design with five treatment groups, 11 years of data, six covariates, three types of parallel trends assumptions, and four estimation techniques.”
Baker, A., Callaway, B., Cunningham, S., Goodman-Bacon, A., & Sant’Anna, P. H. C. (2025). Difference-in-Differences Designs: A Practitioner’s Guide (No. arXiv:2503.13323). arXiv. https://doi.org/10.48550/arXiv.2503.13323
“A starting point for the QuIP [Qualitative Impact Protocol] is the premise that those who were intended to benefit from an intervention know a great deal about what has caused and affected changes in their (and their households’) lives in the recent past, and what has influenced their active decisions to start or stop doing certain activities. Relying on the narrative testimonies of intended beneficiaries removes the need for an independent counterfactual based on interviews with a control or comparison group. This is because comparisons between what happened and what would have happened otherwise are embedded in causal claims within the narrative – our thinking and language is laden with ways of doing this (e.g. through use of the conditional tense and the many ways we can answer ‘why’ questions). Collected with care, narrative accounts are full of explicit and latent counterfactuals; the task is to identify and interpret them. […] We refer to reliance on respondents to provide evidence of the causal chain puzzle themselves as self-reported attribution, and we distinguish it from statistically inferred attribution that generally relies on exposure variation, including comparing treatment and control groups.” (Copestake, Morsink, & Remnant, 2019, pp. 7–8.)
Copestake, J., Morsink, M., & Remnant, F. (2019). Attributing Development Impact. Practical Action Publishing Ltd. https://doi.org/10.3362/9781780447469
I would conjecture* that qualitative testimony about the impact of social programmes is often highly sensitive (if a programme works, then people will tell you it works) but has very poor specificity (if it doesn’t work, people are unlikely to tell you so, e.g., not recognising alternative explanations of change). If this conjecture is true, then it follows that positive feedback about a programme doesn’t tell us much; however, negative feedback would be highly informative. This follows from Bayes’ rule.
Play around with the probabilities here.
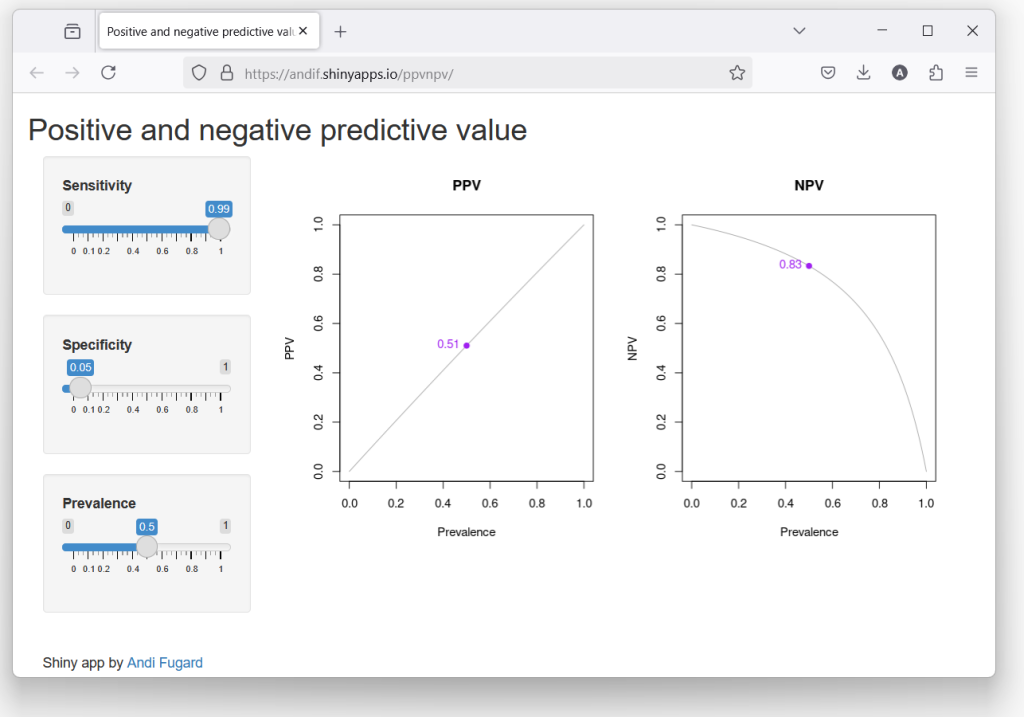
Sensitivity is the probability that someone will tell you the programme works, if it does actually work.
Specificity is the probability that someone will tell you the programme doesn’t work, if it doesn’t actually work.
Prevalence is the probability that programmes of the type you are asking about actually work, e.g., 0.5 would mean for a given type of programme you think the probability it does work is the same as the probability it doesn’t.
Positive predictive value (PPV) is the probability that the programme actually does work if someone tells you it does.
Negative predictive value (NPV) is the probability that the programme doesn’t actually work if someone tells you it doesn’t.
* This conjecture is at the bottom of the evidence hierarchy, whatever the opposite of a gold standard is. Balsa wood standard?
New systematic review by Quang Vuong et al. (in press) on analyses for generalising or transporting findings from an RCT sample to different samples and/or broader populations than the study sample.

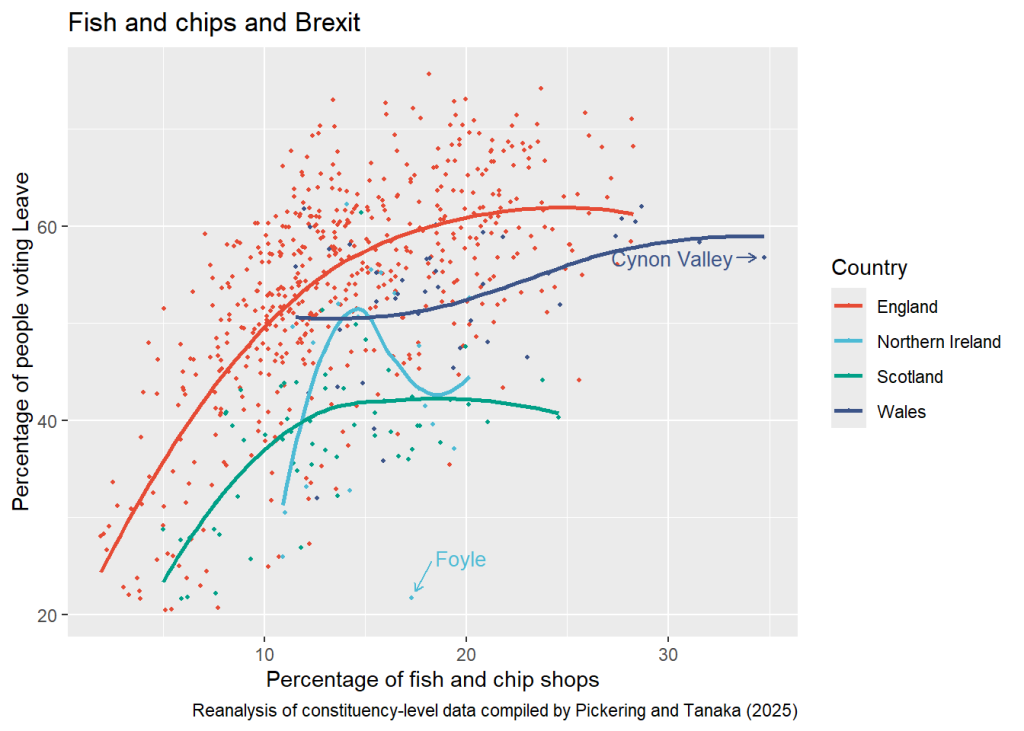
Pickering, S. D., & Tanaka, S. (2025). A taste for deprivation? Fish, chips and leaving the European Union. Geoforum, 104236. Data here.
Here’s a quick ggplot in R. Foyle (Derry) is an interesting outlier, though there’s a very small number of restaurants in the data – maybe data quality. Cynon Valley (south Wales) has 318 chippies.
Hu, Y., & Coulter, R. (2024). Living Apart Together and Older Adults’ Mental Health in the United Kingdom. The Journals of Gerontology, Series B: Psychological Sciences and Social Sciences, gbae192.
Interesting paper urging researchers to go beyond the household as a level of analysis (and data collection).
“Overall, older adults have better mental health when LAT [living apart together] than when single, but little difference in mental health is found across LAT, cohabitation, and marital partnerships. Whereas older singles moving into LAT experience mental health improvements, those moving from LAT to singlehood suffer mental health declines. Although the mental health benefits of moving into LAT are smaller than those of entering cohabitation and particularly marriage, exiting LAT is associated with smaller mental health declines compared with exiting cohabitation and marriage. No statistically significant gender difference is found in the mental health benefits of LAT.”
Though I’m no longer an academic, I occasionally dip into what’s going on in higher education. Things look particularly grim right now.
This blog post from Dec 2023 caught my eye, co-authored by John Kelly, who has written an fantastic critical analysis of Trotskyism. The post takes a look at the politics of UCU Left, and has re-appeared in the context of UCU elections.
It reminded me of one of my all-time favourite tables: the number of members in British Trotskyist organisations (John Kelly, 2018).
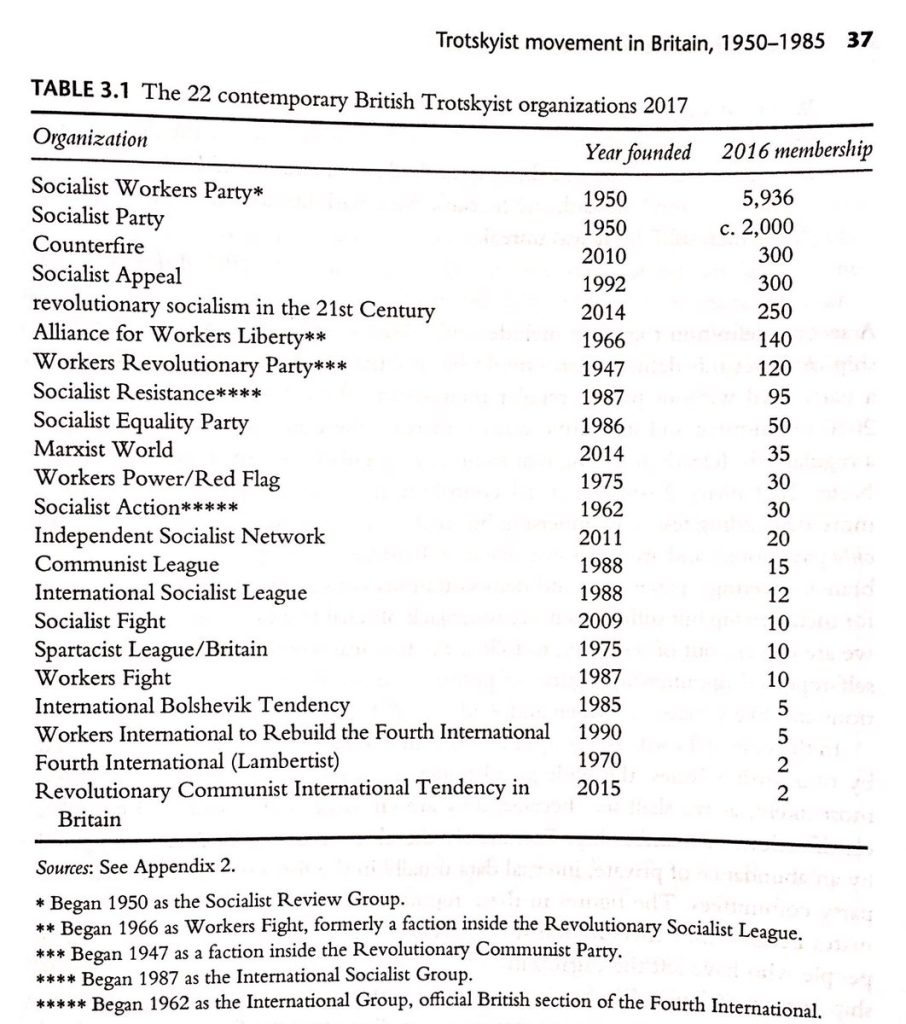
Kelly, J. (2018). Contemporary Trotskyism: parties, sects and social movements in Britain. Routledge.