In a sharp regression discontinuity design (RDD), everyone with a running score at or above the threshold gets the treatment and nobody below does. It looks like the propensity of treatment at or above threshold is 1 and below is 0. However, with measurement error, someone’s running score could have been different and near the threshold this could have affected their treatment assignment. This is the genre of justification often seen for why RDDs act like randomised experiments near the threshold.
Under classical test theory,
observed score = true score + error
and a measure’s reliability is
var(true score) / var(observed score).
(We usually don’t see the true score, hence the need for estimators like Cronbach’s α and McDonald’s ω.)
The picture below is from a simulation where we keep people’s true running score fixed (normal distro, mean = 50, SD = 20) but let the observed running score randomly vary due to the unreliability. The probability of treatment is then the proportion of times across simulations that someone ends up in treatment.
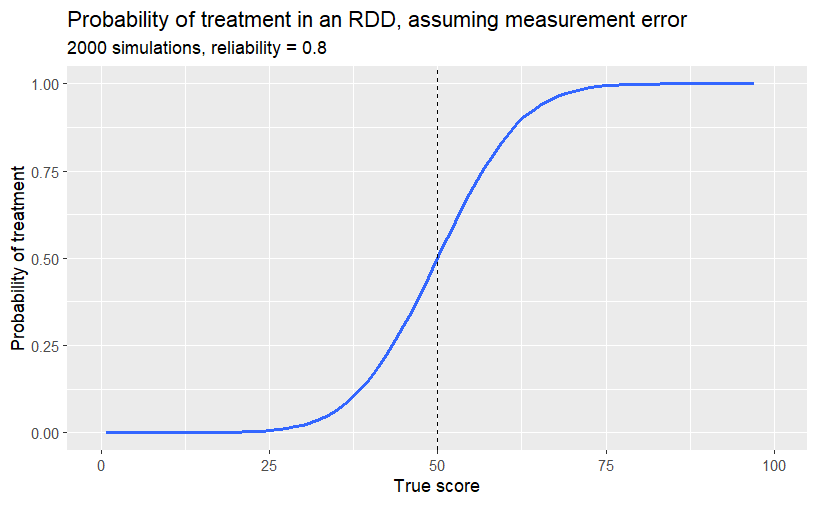
So, close to the threshold, the probability of treatment is nearest 50-50.
(I tried and failed to find this pic in the lit; the closest I could spot is in Scott Cunningham’s Mix Tape.)