Part 1: ATT(g, t) estimates and pooling across groups. Standard errors coming later.
Tag: R
CORELS (Certifiable Optimal RulE ListS)
“CORELS (Certifiable Optimal RulE ListS) is a custom discrete optimization technique for building rule lists over a categorical feature space. Our algorithm provides the optimal solution, with a certificate of optimality. By leveraging algorithmic bounds, efficient data structures, and computational reuse, we achieve several orders of magnitude speedup in time and a massive reduction of memory consumption. Our approach produces optimal rule lists on practical problems in seconds. This framework is a novel alternative to CART and other decision tree methods.”
How to Interpret Statistical Models Using {marginaleffects} for R and Python
New paper:
Arel-Bundock, V., Greifer, N., & Heiss, A. (2024). How to Interpret Statistical Models Using marginaleffects for R and Python. Journal of Statistical Software, 111(9), 1–32.
Abstract:
“The parameters of a statistical model can sometimes be difficult to interpret substantively, especially when that model includes nonlinear components, interactions, or transformations. Analysts who fit such complex models often seek to transform raw parameter estimates into quantities that are easier for domain experts and stakeholders to understand. This article presents a simple conceptual framework to describe a vast array of such quantities of interest, which are reported under imprecise and inconsistent terminology across disciplines: predictions, marginal predictions, marginal means, marginal effects, conditional effects, slopes, contrasts, risk ratios, etc. We introduce marginaleffects, a package for R and Python which offers a simple and powerful interface to compute all of those quantities, and to conduct (non-)linear hypothesis and equivalence tests on them. marginaleffects is lightweight; extensible; it works well in combination with other R and Python packages; and it supports over 100 classes of models, including linear, generalized linear, generalized additive, mixed effects, Bayesian, and several machine learning models.”
The causal inference task view on CRAN
“Causal inference can be seen as a subfield of statistical analysis. It is used in various fields such as econometrics, epidemiology, educational sciences, etc. With causal inference one addresses questions about effects of a treatment, intervention, or policy on some target over a given sample or population. Under certain identifiability and model assumptions, causal inference can be carried out by fitting simple regression models or combining several regression models in a specific way as will be sketched out later. For observational data, additional untestable assumptions have to be made to (non-parametrically) identify causal effects.”
The CRAN task view is over here.
Advent of Code 2024
I’m doing Advent of Code again. My answers thus far are on GitHub.
This year, I vow to stop when it takes up too much time… Last time I tried (2022) over here. It will be interesting to see if I can reuse any code or ideas.
ESDist: Calculate and visualise field-specific ESDs
“The ESDist package is designed to calculate and visualise field-specific effect size distributions, based on data that can easily be obtained from meta-analyses.”
Looks like a relatively painless way to develop alternatives to Cohen’s 0.2, 0.5, 0.8 SD landmarks, including using limit meta analysis (Rücker et al.) to adjust individual effect sizes for publication bias.
Sharp variance bounds for SATE: giving Mikhaeil and Green’s (2024) work a test drive
The standard ANCOVA-style way to estimate the sample average treatment effect (SATE) in an efficacy RCT yields an unbiased estimate of the SATE; however, the standard error is a little too big, which means the confidence interval is a little too wide. The reason for this is that the correct standard error depends on the correlation between potential outcomes, only one of which is realised for each participant depending on which experimental condition they ended up in, making that correlation impossible to calculate.
This problem was pointed out by Neyman (1923/1990). Aronow, Green, and Lee (2014) proved a result that puts bounds on the correlation based on the observed marginal distribution of outcomes; however, their approach only works for a model without any covariates.
I’m excited by a new preprint by Mikhaeil and Green (2024) that extends the approach to models with covariates and provides R code, in the {sharpvar} package.
I gave it a go with simulated data; knitted code and output over here.
ntfy
“ntfy (pronounce: notify) is a simple HTTP-based pub-sub notification service. It allows you to send notifications to your phone or desktop via scripts from any computer, entirely without signup, cost or setup. It’s also open source if you want to run your own. Visit ntfy.sh for more details.”
{ntfy} is a lightweight R wrapper for this service.
Four ways to calculate the probability that if it rains, I have an umbrella
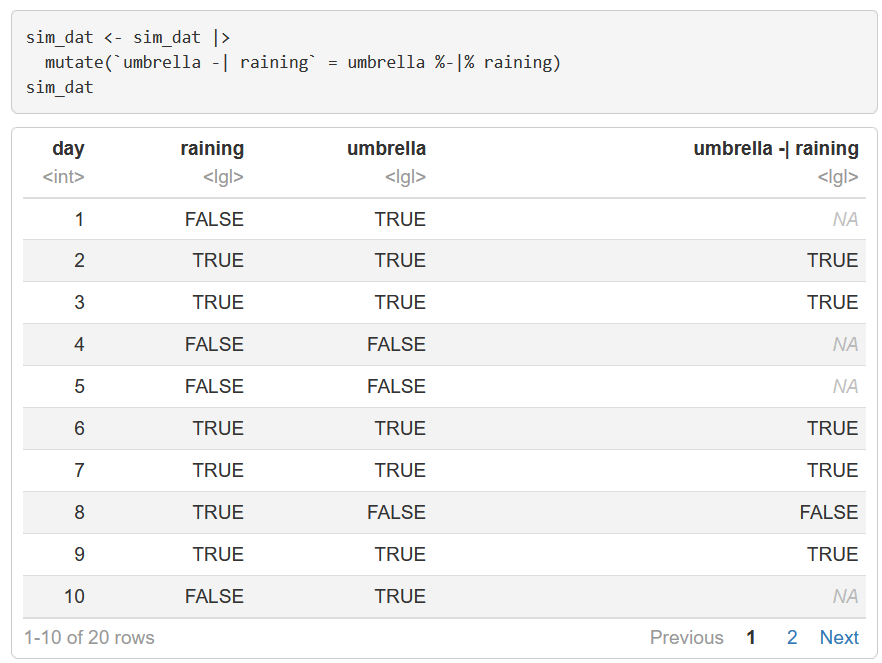
This post shows four ways to calculate the conditional probability that I have an umbrella, given that it’s raining, \(P(umbrella|raining)\). The first way uses the ratio formula, \(P(raining \land umbrella)/P(raining)\). The second uses a three-valued logical connective, the conditional event, which can be traced back to the work of Bruno de Finetti in the 1930s (see, e.g., Baratgin, 2021). The third filters the dataset to rows where it’s raining before counting the proportion of those where I had an umbrella. The fourth uses logistic regression.
Useful package: clubSandwich
{clubSandwich} “provides several cluster-robust variance estimators (i.e., sandwich estimators) for ordinary and weighted least squares linear regression models, two-stage least squares regression models, and generalized linear models. Several adjustments are incorporated to improve small-sample performance. The package includes functions for estimating the variance-covariance matrix and for testing single- and multiple-contrast hypotheses based on Wald test statistics. Tests of single regression coefficients use Satterthwaite or saddlepoint corrections. Tests of multiple-contrast hypotheses use an approximation to Hotelling’s T-squared distribution.”
Includes the approximation of the leave-one-cluster-out jackknife variance estimator by Bell and McCaffrey (2002; CR3) for LMMs in lme4::lmer. Doesn’t currently (27 Oct 2024) support GLMMs.