Social policy evaluators investigate whether public services and infrastructure – such as housing, education, health care, policing, and transport – are making a meaningful difference to the people who rely on them, not just meeting official targets. Evaluations span many levels, from local support services (such as mentoring programmes for young people) to major infrastructure projects (such as transport links) and national reforms (such as changes to sentencing guidelines).
Evaluations often combine different approaches. These might include analysing trends and differences in outcomes (such as school attendance rates or reoffending figures) and gathering personal accounts of how services affect people’s lives (such as whether someone feels safer after contact with the police). Evaluators also examine how services are delivered in practice: what staff and service users actually do when engaging with services, the challenges they face, and the conditions that shape their experiences and outcomes.
Evaluation is not only about finding out whether service use is “associated with” outcomes – it’s about testing whether a service actually caused a change. This often involves using advanced methods from statistics, economics, and computer science. There is also growing recognition that people affected by services should play a key role in shaping how those services are designed and evaluated – advice from experts by lived experience complements advice provided by professionals.
Beyond identifying what works and what doesn’t, social policy evaluation aims to deepen our understanding of how and why services function. It does this by developing and testing theories of change. The vision is for decisions about public services to be grounded in cumulative evidence of effectiveness, and shaped by the people those services are meant to support.
“… random allocation in a clinical trial means that all patients have the same chance of receiving any particular treatment (and in most cases each treatment is equally likely). Patients should be entered into a trial before their allocation to a particular treatment is known. A common misconception exists that allocation based on, for example, odd or even dates of birth or hospital numbers is random. These systematic allocation methods, however, clearly violate the requirement that all patients have the same chance of receiving each treatment. Alternate allocation does not in principle suffer from such problems, but there is a risk of abuse because the investigator’s knowledge of the next treatment may lead to some patients being excluded from the trial – making this method inadvisable.”
If you’re running an RCT, why bother balancing covariates between treatment and control, e.g., using blocking or minimisation?
Doing so doesn’t make it any more likely that your confidence interval will include the true treatment effect – if it did, then what about the thousands of unmeasured covariates, which randomisation is supposed to address…?
Instead, balancing covariates makes inference more efficient when you statistically adjust for those measured covariates – as you will want to do if they’re correlated with the outcome variable.
Here’s Senn (1994, p. 1721) – a paper I seem to cite every few weeks:
“… what is the value of balance as regards validity of an inference? Answer: none. This does not mean that balance is not useful. Its use is that, having decided to condition, we minimize the standard errors of our treatment effects if our covariate is orthogonal to treatment. This is the true value of balance which is an issue of efficiency, not validity.”
So it’s regression analysis 101: if you have an imbalanced covariate, then it is correlated with your treatment variable. The greater the correlation, the greater the standard error of the treatment effect estimate. Though this will be mitigated if that covariate is also highly correlated with the outcome, which will reduce the standard error.
Pinference: Probability Inference for Propositional Logic. “Implementation of T. Hailperin’s procedure to calculate lower and upper bounds of the probability for a propositional-logic expression, given equality and inequality constraints on the probabilities for other expressions. Truth-valuation is included as a special case. Applications range from decision-making and probabilistic reasoning, to pedagogical for probability and logic courses.”
RobinCar2: ROBust INference for Covariate Adjustment in Randomized Clinical Trials. “Performs robust estimation and inference when using covariate adjustment and/or covariate-adaptive randomization in randomized controlled trials.” Though see this post.
‘[…] talking about statistics as a valid form of Indigenous knowledge and as an important tool for Indigenous decolonization efforts raises strong feelings for many. We continue to take the position that Indigenous knowledge must include any form of knowledge that benefits Indigenous Peoples. We are not suggesting that no differences exist between Indigenous and “Western” forms of knowledge (to give one example of many, ceremonial knowledge can and does form the backbone of Indigenous governing systems, though it would rarely be confused with that of Western governing systems). Our point instead is simply that Indigenous Peoples are powerfully embedded in the last five centuries of colonial projects. As such, any tools that help us push back against such projects, and that assist us in “constituting ourselves anew,” are worth discussing. And we will argue further that statistics—literally the “language of state”—must be included as one of those tools. It is too important a vector in the fight for Indigenous control of our collective lives and territories not to.’
Andersen, C. (2025). The Statistical Field, Writ Indigenous. In C. Andersen, M. Walter, T. Kukutai, & C. Gabel, Indigenous Statistics (2nd ed., pp. 30–47). Routledge. https://doi.org/10.4324/9781003173342-3
Dear evaluation community, I’ve set myself a challenge. This month, the next time someone asks what I do, I’ll say I’m a social policy evaluator – whether that’s a new neighbour, someone in the chillout space at FOLD, or a friend of a friend over dinner. Here’s how I got there.
I’ve been pondering again why I hesitate to call myself an evaluator and can think of at least two reasons. Firstly, it feels a bit like “auditor”. I imagine someone in suit and tie, poring over a company’s policies and procedures, checking that their accounts add up. Evaluation can be a bit of that, but it’s much more exciting! It’s one of the few corners of social science where we are not only licenced to draw causal inferences from complex evidence – it’s demanded of us. We can’t hide behind “correlation doesn’t imply causation”. We have to judge whether, on the balance of evidence (including prior research), a programme seems to work or make things worse. The programmes we evaluate often reach many thousands of people and have a huge impact on people’s lives.
The second issue with “evaluator” is that it’s ridiculously broad. Am I evaluating your dress sense or how you dance? Whether you’re sufficiently polite with waiters? Am I running psychometric assessments to help evaluate staff performance? We are all evaluators in some sense, however often we share the judgements.
So, I usually say I’m a social researcher and that I work in social policy. I explain something about what I do by example. However, for October, I’m trialling “evaluator”, because I conduct evaluations. It feels like I’ll need to add a word or two to that title to get going.
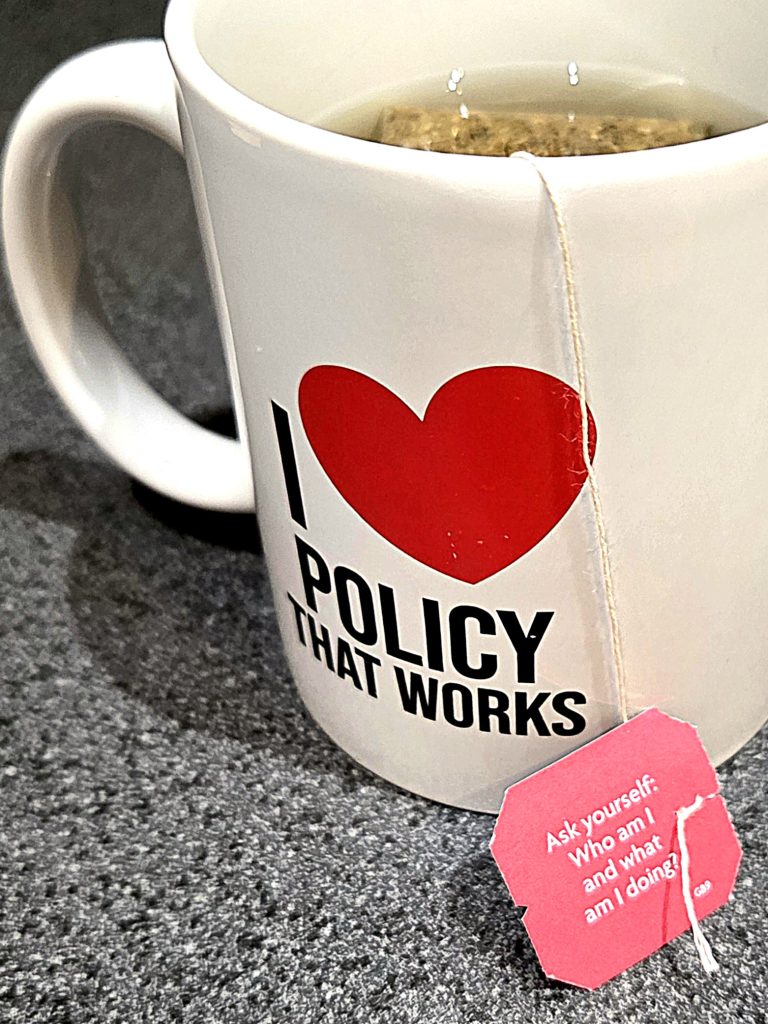
How about “policy evaluator”? Do people know what a policy is? I reached for the nearest book on policy, which happened to be Social Policy, by Hartley Dean (2019). Page 1, first sentence: “When I tell people I teach Social Policy, a fairly common response is ‘Oh! … [pause]. What’s that exactly?” He even adds “social” to the term and that doesn’t help; maybe policy is just as opaque as “evaluation”. Dean defines social policy rather broadly: “the study of human wellbeing” – that’s going to open too many cans of worms; I just want to get on with (or escape) the conversation.
Maybe the Green Book will help me navigate the opening? “A Policy is a statement of intent that is implemented through a procedure or a protocol and a deliberate system of principles to guide decisions and achieve rational outcomes,” it says (HM Treasury, 2022, p. 6).
Closer to what most of us generally do is down at the programme level. The Book says: “A Programme is an interrelated series of Sub-Programmes, Projects and related activities in pursuit of an organisation’s longer-term objectives. Programmes deliver outcomes through changes in services.”
That last bit seems key: changes in services. I’ll hold onto that as a follow-up answer and have a few examples ready to explain.
Okay, so how about “programme evaluator”. That’s definitely a thing – it appears in article and book titles (a random selection from my Zotero stash: Abadie & Cattaneo, 2018; Chen, 1996; Cook & Shadish, 1986; Donna M. Mertens & Wilson, 2019; Perloff et al., 1976). But do people know what a programme is? Tech bros and adjacent might think about the software kind of program. Others might think it’s about TV shows. Since this is a blog post and very few people will read this far, I’m going to sneak into CoPilot and ask it to simulate a survey of the UK adult population. It made up a crosstab for me with fictitious percentages by age group. For what it’s worth, TV shows and software/apps dominated as the most common interpretations of “programme”.
“Social” didn’t help with social policy – Hartley Dean tried and still got blank stares. Maybe adding it to programme evaluation or policy evaluation does help. So, finally I asked CoPilot to (pretend to) run an experiment comparing:
evaluator,
policy evaluator,
programme evaluator,
social policy evaluator, or
social programme evaluator.
Each invented participant was “asked”, “What do you think someone with this job does?” The primary outcome was the percentage of respondents in each age band who correctly identified the role’s social policy/programme focus.
It was a close tie between social programme evaluator and social policy evaluator, with the latter winning by a few entirely fictitious percentage points in each age group. Based on the 21st century tradition of decision by digital hallucination, for the month of October my profession is going to be: social policy evaluator.
One objection to this title that may be raised (it was raised in my head) is that we don’t actually evaluate policies, if they are defined as statements of intent as per the Green Book. That’s too vague and far from something that, say, a quasi-experiment could study. However, programmes interact with policies, and findings from evaluations (should) inform policies. It may be helpful to signal that we are aware of and engage in the broader context, not only individual programmes independently of how they ended up being trialled. If a programme is shown to work, that has clear implications for social policy.
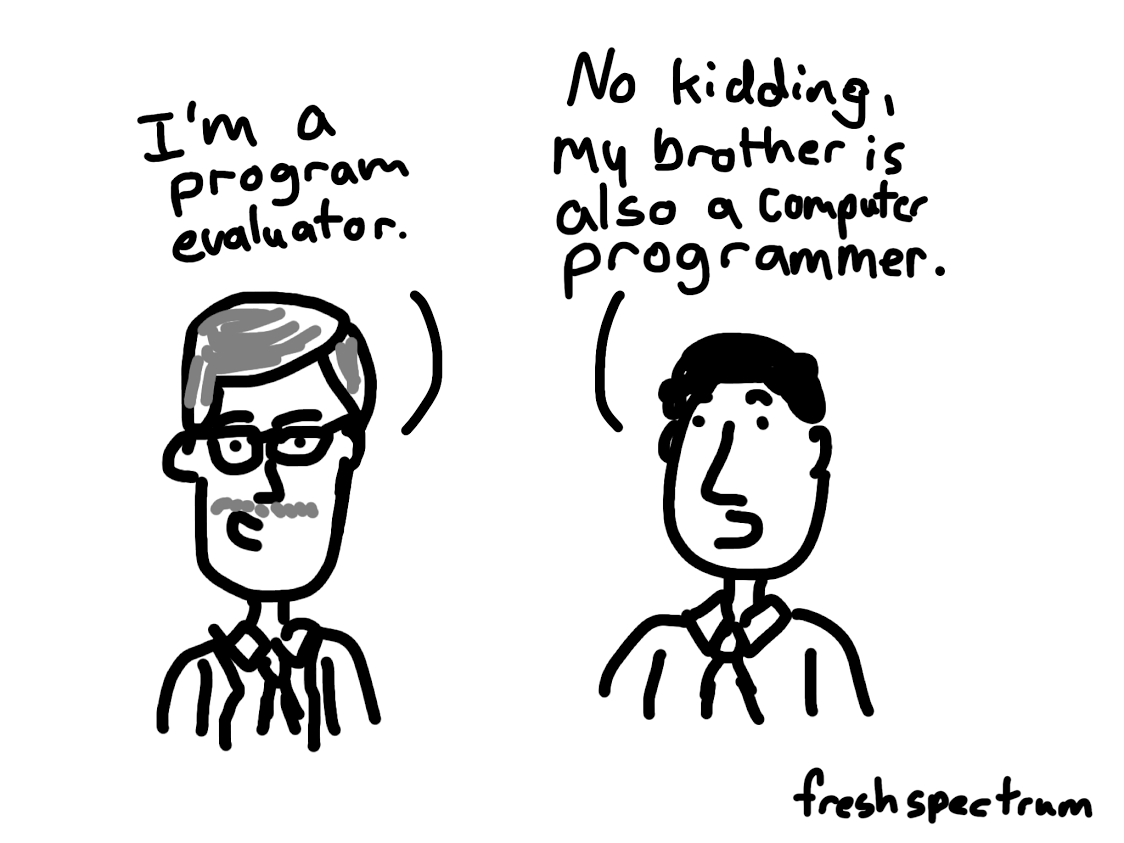
Thanks Julian King for pointing me to the Chris Lysy comic.
Edited to add (11 Oct 2025): Thanks also to Brad Astbury, who pointed me to an interesting article exploring different ways of explaining what evaluators do, by Sarah Mason (2023). This included an experiment, which randomly assigned people to one of seven different explanations. The key, Mason found, was to include examples. Here’s a template in the conclusions of the paper that illustrates what seems to work best (p. 564):
“You know how government agencies and not-for-profit organizations spend money on social programs like school lunch programs or substance abuse programs?
“Well, I gather and analyze data about those programs to find out if they do any good or not. The hope is that we’ll be able to provide data and feedback that will help decision makers improve the programs’ performance and their value to society.”
References
Abadie, A., & Cattaneo, M. D. (2018). Econometric Methods for Program Evaluation. Annual Review of Economics, 10, 465–503.
Chen, H. (1996). Typology for Program Evaluation. Evaluation Practice, 17, 121–130.
Cook, T. D., & Shadish, W. R. (1986). Program Evaluation: The Worldly Science. Annual Review of Psychology, 37, 193–232.
Dean, H. (2019). Social policy (3rd ed.). Polity.
Donna M. Mertens, & Wilson, A. T. (2019). Program evaluation theory and practice. The Guilford Press.
HM Treasury. (2022). The Green Book: Central Government Guidance on Appraisal and Evaluation.
Mason, S. (2023). Just Give Me an Example! Exploring Strategies for Building Public Understanding of Evaluation. American Journal of Evaluation, 44(3), 549–567.
Perloff, R., Perloff, E., & Sussna, E. (1976). Program Evaluation. Annual Review of Psychology, 27, 569–594.
Here’s a half‑baked idea, inspired by multiple conversations about randomised controlled trials versus quasi‑experiments at the Australian Evaluation Society 2025 conference.
Outcome measurement databases are now a familiar part of evaluation. One database I frequently use is the Child Outcomes Research Consortium (CORC) Directory of Outcome Measures. The Education Endowment Foundation (EEF) has developed similar resources.
Databases like these make it easier to map theories of change outcomes to measures, and they often include information on psychometric properties such as reliability, and pre‑post correlations, which are handy for informing power calculations.
While outcomes receive this collective attention, quasi‑experimental designs hinge just as much on the quality of their covariates. Pre‑intervention measures of outcomes are especially important, given how highly correlated they tend to be with outcomes. That’s the covariate we get for free once we fix on an outcome, but other characteristics of people and contexts are essential too – often a large number of them.
So, the half‑baked idea is this: evaluation should develop a covariates database, organised by topic area and outcome, to provide evaluators with a shared resource to aid the design of quasi‑experiments. A potential name for this shared resource is the Covariate Commons.
The selection of covariates should always be considered on a case‑by‑case basis, guided by the most likely confounding variables (those that correlate both with who engages with a programme and with outcomes). However, evaluators know that some variables appear repeatedly across studies and sometimes across topic areas (age, gender, social deprivation, to name three).
What do you think? Is there already an example of this for some topics? And who should be responsible for developing and maintaining it?
I have some lived-experience to report and a brief reflection on an RCT. Content warning: it involves a brief description of an injury, but I lived happily ever after!
I recently dislocated my shoulder after slipping on a traverse climbing wall – ten minutes before the end of an introductory bouldering session. Thankfully, I wasn’t far off the ground. As far as these things go, it was a “good” dislocation: I feel fine and am starting physio imminently.
It wasn’t my first. Over a decade ago, I had a dislocation and was given nitrous oxide (gas and air) at A&E while they reattached my arm. This time, I was handed Penthrox – also known as the green whistle – a vape-sized handheld device that delivers methoxyflurane.
Subjectively, Penthrox felt much better than gas and air. During the procedure, I’d describe my mental state as “relaxed, pain-free, and a bit messed up but in a good way.” Once my shoulder was back in place, I would say I was “elated and very chatty” (emphasis on the “very”: apologies to everyone else waiting for an x-ray with me).
In contrast, gas and air didn’t do as much for the pain, though it did have the “messed up” component, which was helpfully distracting – at least as I remember it. There were plenty of confounding variables: injury severity (previously I needed an ambulance, this time not) and memory effects among them. So I wondered what the evidence says about the average differences between the two.
I came across a systematic review (Porter et al., 2017). Both gas and air and Penthrox outperformed placebo; however, no statistically significant difference was found between them in direct comparisons. But hang on – someone ran a study comparing Penthrox with placebo? I’m not sure I’d have met the inclusion criteria, but imagining being invited to take part in a placebo-controlled trial while hanging onto my arm, I suspect my response would have involved expressive language and a firm decline.
The justification for the placebo-control was: “Use of an active comparator, although preferred, would have posed considerable challenges to keep the study blind because of the unique mode of delivery and smell of methoxyflurane” (Coffey et al., 2014, p. 614).
An interesting case example to discuss.
References
Coffey, F., Wright, J., Hartshorn, S., Hunt, P., Locker, T., Mirza, K., & Dissmann, P. (2014). STOP!: A randomised, double-blind, placebo-controlled study of the efficacy and safety of methoxyflurane for the treatment of acute pain. Emergency Medicine Journal, 31(8), 613–618.
Porter, K. M., Siddiqui, M. K., Sharma, I., Dickerson, S., & Eberhardt, A. (2017). Management of trauma pain in the emergency setting: Low-dose methoxyflurane or nitrous oxide? A systematic review and indirect treatment comparison. Journal of Pain Research, 11, 11–21.
One of the reasons that people test covariate balance in trials is because they have a vague sense that they should check whether something has gone wrong with random assignment – but often without a clear idea of what that something is. One thing that could go wrong is that people involved in participant recruitment, such as clinicians, could be deliberately trying to subvert assignment so people receive the treatment clinicians think they need.
Brown et al. (2005) asked 25 clinicians and research nurses whether they tried to predict treatment allocation and, if they did, how, and why.
Reassuringly, most (21 out of 25) said they did not, citing that they were “aware that this is wrong”, wanted to “remain impartial to the treatments”, were “unable to, allocation is out of our hands”, or thought it would be too complicated to do so.
The 4 out of 25 who said that they did try to predict treatment allocation reported keeping a log of previous allocations:
“A few investigators stated that they hoped some patients would be randomized to specific treatments, giving such reasons as that patients would be able to travel more easily or that some would have a perceived benefit from a particular treatment.”
Quasi-experimentalists will be familiar with King and Nielsen’s (2019) landmark paper, Why Propensity Scores Should Not Be Used for Matching. This specifically critiqued the use of propensity scores for matching; other common uses of propensity scores, such as inverse probability weighting, were not affected. An interesting paper has appeared by Fei Wan (2025) critiquing King and Nielsen’s findings.
Fei Wan’s targets include:
The inappropriateness of using an average pairwise covariate distance between treated and closest comparison match to evaluate PSM. Distances are always nonnegative so can’t take account of positive and negative differences averaging out. It’s already known that two observations with the same propensity score are likely to have different covariate values, but it’s ok if they are random.
King and Nielsen used a cherry-picking approach for model selection, trying 512 different specifications and selecting the one that yields the largest average treatment estimate. This is just poor analysis practice.
Fei Wan recommends machine learning approaches to estimate propensity scores, rather than the common use of logistic regression.