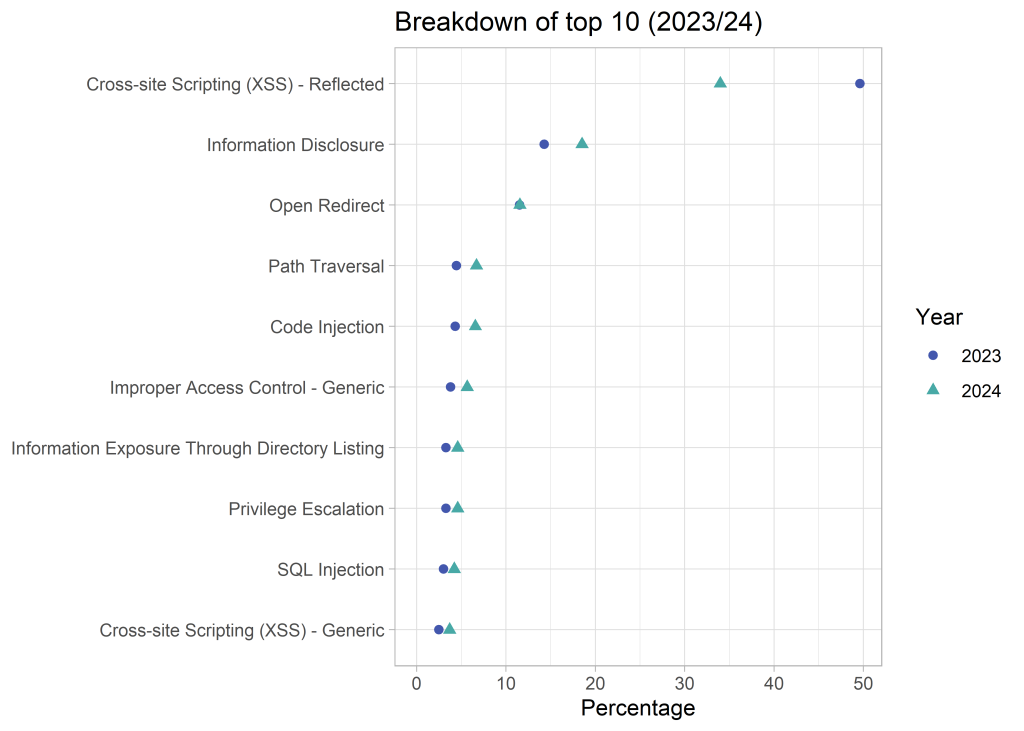
ggauto

ggauto is designed to choose the best chart type, based on the type of data that you have. That means that you need to pre-process your data into the correct type before plotting it. This is a requirement to make ggauto possible, but is more generally a good idea because it forces you to understand what your data is before you plot it.”

Looks cool. Blog post here.
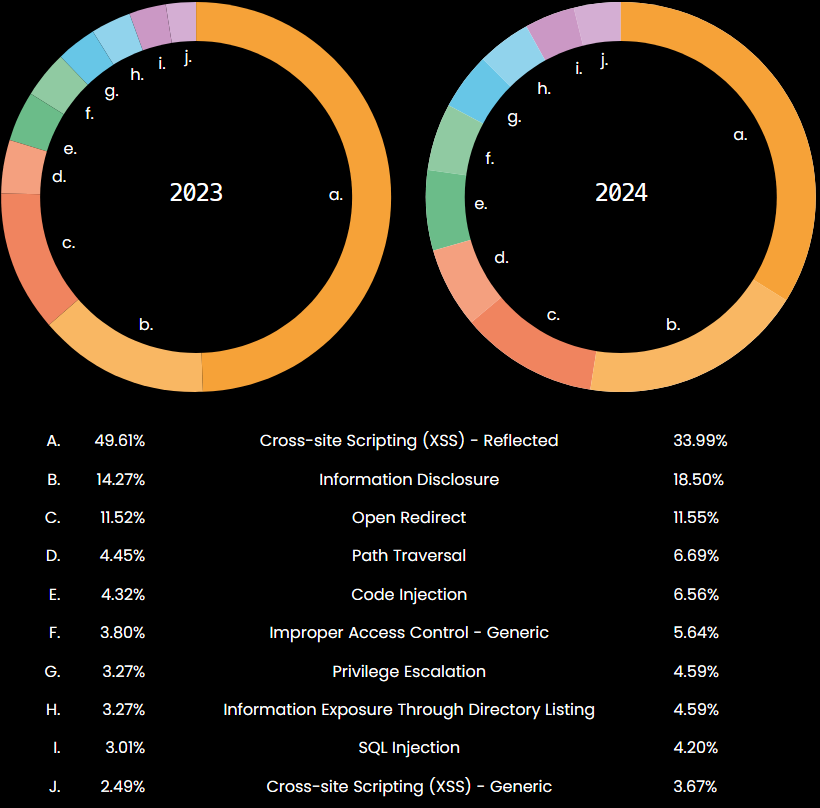
Install from CRAN: install.packages(“ggauto”)

A new checklist for designing scientific data visualizations, by Helena Klara

Interesting new checklist for designing scientific data visualizations, by Helena Klara Jambor. The first test is to ask 2 to 5 people to explain what they see first when looking at the visualisation. I like how this treats graphs similarly to how user interfaces are treated in HCI/UX research: checking whether a graph works as intended is an empirical problem.