New systematic review by Quang Vuong et al. (in press) on analyses for generalising or transporting findings from an RCT sample to different samples and/or broader populations than the study sample.

Personal website – any views expressed herein are my own unless otherwise obvious
New systematic review by Quang Vuong et al. (in press) on analyses for generalising or transporting findings from an RCT sample to different samples and/or broader populations than the study sample.
Just out in Statistics in Medicine, this is a helpful review of approaches to adjusting for observed confounding in non-randomised evaluations (and other studies). Includes a concise summary of assumptions, using the Neyman–Rubin potential outcomes framework.
Keele, L., & Grieve, R. (2025). So Many Choices: A Guide to Selecting Among Methods to Adjust for Observed Confounders. Statistics in Medicine, 44(5), e10336.
One of the clearest examples of process tracing I have seen is in political science. Jakob Hauter (2023) analyses open source evidence concerning the 2014 occupation of Sloviansk and Kramatorsk in Donbas, to test the extent to which State actors were involved.
Hauter, J. (2023). Forensic conflict studies: Making sense of war in the social media age. Media, War & Conflict, 16(2), 153-172.
Useful blog post (2022, last updated 2024) by Iris Eekhout showing how to update the predictor matrix and setup passive imputation using {mice} so that:
“Consider a carefully controlled nonrandomized study – a study in which there are no obviously important prior variables that systematically differ in the E trials and the C trials. In such a study, there is a real sense in which a claim of ‘subjective randomization’ can be made. For example, if the study was composed of carefully matched pairs of trials, there might be a very defensible belief that within each matched pair each unit was equally likely to receive E as C in the sense that if you were shown the units without being told which received E, only half the time would you correctly guess which received E.”
Rubin, D. B. (1974, p. 698). Estimating causal effects of treatments in randomized and nonrandomized studies. Journal of Educational Psychology, 66(5), 688–701.
See also:
“Matching can be thought of as a technique for finding approximately ideal experimental data hidden within an observational data set.”
King, G., & Nielsen, R. (2019, p. 442). Why Propensity Scores Should Not Be Used for Matching. Political Analysis, 27(4), 435–454.

Fun research providing an alternative to computer-based data simulation for developing and testing machine learning algorithms: Gamella, Peters, and Bühlmann (2025) built two physical devices (“causal chambers”) consisting of a light tunnel and wind tunnel. These devices were designed so that the underlying physical systems are well understood, which means that the true causal models are known. The systems are automatically controlled, allowing large quantities of data to be produced. The authors provided case studies for out-of-distribution generalization, change point detection, independent component analysis (ICA) and symbolic regression.
They have a website and GitHub repo of datasets from the case studies.
Gamella, J. L., Peters, J., & Bühlmann, P. (2025). Causal chambers as a real-world physical testbed for AI methodology. Nature Machine Intelligence. Online first.
The Five Safes could be a good way to help think about making data available to “turbocharge” AI [1, 2]. Maybe they already are – but the comms needs to accelerate if so.
Safe projects: Is the proposed use of the data (e.g., ethically) appropriate?
Safe people: Can the analysts be trusted to use it in an appropriate manner? Accredited Researcher registers that many of know and love might help.
Safe data: Is there a disclosure risk in the data itself?
Safe settings: Does the access facility limit unauthorised use? Interesting for cloud-based compute.
Safe outputs: Are the statistical results non-disclosive? This will be particularly challenging for models with millions of parameters.
These are five dimensions and they all need to be considered together to determine whether an approach to making data available is safe. For example if it’s impossible to entirely anonymise data, then the other dimensions need to be beefed up.
[1] Prime Minister sets out blueprint to turbocharge AI. Department for Science, Innovation and Technology, Prime Minister’s Office, 10 Downing Street, The Rt Hon Peter Kyle MP, The Rt Hon Sir Keir Starmer KCB KC MP and The Rt Hon Rachel Reeves MP (13 Jan 2025)
[2] Desai T, Ritchie F, & Welpton R. (2016). Five Safes: Designing data access for research. Working Paper.
Periodically I listen to contemporary debates in evaluation and wonder how much progress there has been in the past fifty years. Here’s a picture from Carol Weiss (1972, Figure 3–3, p. 50; reprinted in 1996):
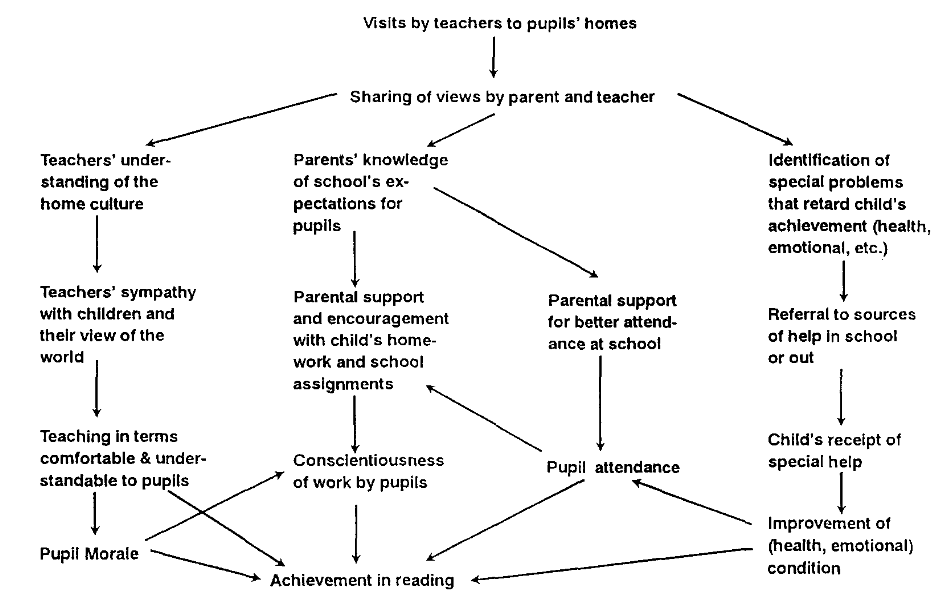
Weiss called it a model of a programme; now we would use the term programme theory or theory of change. About half of the next page (Weiss, 1972, p. 51) is filled with intriguing footnotes. The first notes the similarity between the diagram above and a statistical approach:
“As the similarity between Figure 3–3 and a path diagram suggests, path analysis is a useful way of estimating the strength of the linkages. When the necessary conditions for each path analysis are met, path coefficients will represent the magnitude of effects for each arrow.”
On path analysis, Weiss cites Blalock’s (1969) Theory construction from verbal to mathematical formulations. Structural equation modelling, path analysis plus confirmatory factor analysis, turned out to be a popular way to test theories in social science (see, e.g., MacCallum & Austin, 2000; Zyphur, Bonner, & Tay, 2023).
The same footnote also summarises the Automatic Interaction Detector (AID), an early example of a data-driven partitioning procedure:
“Another analytic device, particularly useful when one step in the chain is totally or largely conditional on the one before, is the Automatic Interaction Detector (AID). Unlike path analysis, this type of ‘branch’ analysis shows whether the program is producing strong effects for subsamples of the group. This is a matter of both theoretical and programmatic interest, because if there are differential effects, special programs can be developed to fit special groups.”
AID and its successors are data hungry and liable to overfitting data if misused; however, there is a rich literature on how to use them and stay out of trouble. Loh (2014) reviews fifty years of that literature, beginning with AID (p. 330):
“Despite their novelty, or perhaps owing to it, AID and THAID did not initially attract much interest in the statistics community. Einhorn (1972) showed by simulation that AID can severely overfit the data. Doyle (1973) pointed out that if two or more variables are highly correlated, at most one may appear in the tree structure. This problem of masking can lead to spurious conclusions about the relative importance of the variables. Bishop et al. (1975) criticized AID for ignoring the inherent sampling variability of the data. Around the same time though, the idea of recursive partitioning was gaining steam in the computer science and engineering communities as more efficient algorithms for carrying out the search for splits began to appear (Chou 1969; Henrichon & Fu, 1973; Meisel & Michalopoulos, 1977; Payne & Meisel, 1977; Sethi & Chatterjee, 1991).”
(Example newer algorithms are implemented in {rpart} in R.) Weiss’s footnote and these statistical approaches are clear examples of trying to tackle the “what works best for whom” problem, which for some reason (along with “context”) is now associated, like a Pavlovian response, with “realist” evaluation. We need to do better.
Blalock, H. M., Jr. (1969). Theory construction from verbal to mathematical formulations. Prentice-Hall Inc.
Loh, W. (2014). Fifty Years of Classification and Regression Trees. International Statistical Review, 82(3), 329–348.
MacCallum, R. C., & Austin, J. T. (2000). Applications of structural equation modeling in psychological research. Annual Review of Psychology, 51(1), 201-226.
Weiss, C. H. (1972). Evaluation research: Methods of assessing program effectiveness. Prentice-Hall, Inc.
Weiss, C. H. (1996). Excerpts from evaluation research: Methods of assessing program effectiveness. Evaluation Practice, 17(2), 173–175.
Zyphur, M. J., Bonner, C. V., & Tay, L. (2023). Structural equation modeling in organizational research: The state of our science and some proposals for its future. Annual Review of Organizational Psychology and Organizational Behavior, 10(1), 495-517.
“Within the academy, the word theory has a lot of capital. I have always been interested in how the word theory itself is distributed; how some materials are understood as theory and not others. […] As a student of theory, I learned that theory is used to refer to a rather narrow body of work. Some work becomes theory because it refers to other work that is known as theory. A citational chain is created around theory: you become a theorist by citing other theorists that cite other theorists.” (Ahmed, 2017, p. 8)
Ahmed, S. (2017). Living a feminist life. Duke University Press.
A paragraph from the archive (Fugard, 2020, p. 525–6):
“Theories in social science are underdetermined by evidence. They are produced by people who have biases and differing values, so two theorists may interpret the same evidence in different ways. Quantitative research is no exception since researchers have to choose what to measure and how to model it. For non-experimental data, many causal models are mathematically equivalent, so assumptions beyond the data are required (Pearl, 1995). Although there are criteria for preferring one theory over another, such as accuracy, simplicity, and scope, applying them is not always straightforward, even in natural sciences (Kuhn, 1977).”
Fugard, A. (2020). Should trans people be postmodernist in the streets but positivist in the spreadsheets? A reply to Sullivan. International Journal of Social Research Methodology, 23, 525–531.
Kuhn, T. S. (1977). Objectivity, value judgment, and theory choice. In The essential tension: Selected studies in scientific tradition and change (pp. 320–339). The University of Chicago Press.
Pearl, J. (1995). Causal diagrams for empirical research. Biometrika, 82(4), 669–688.