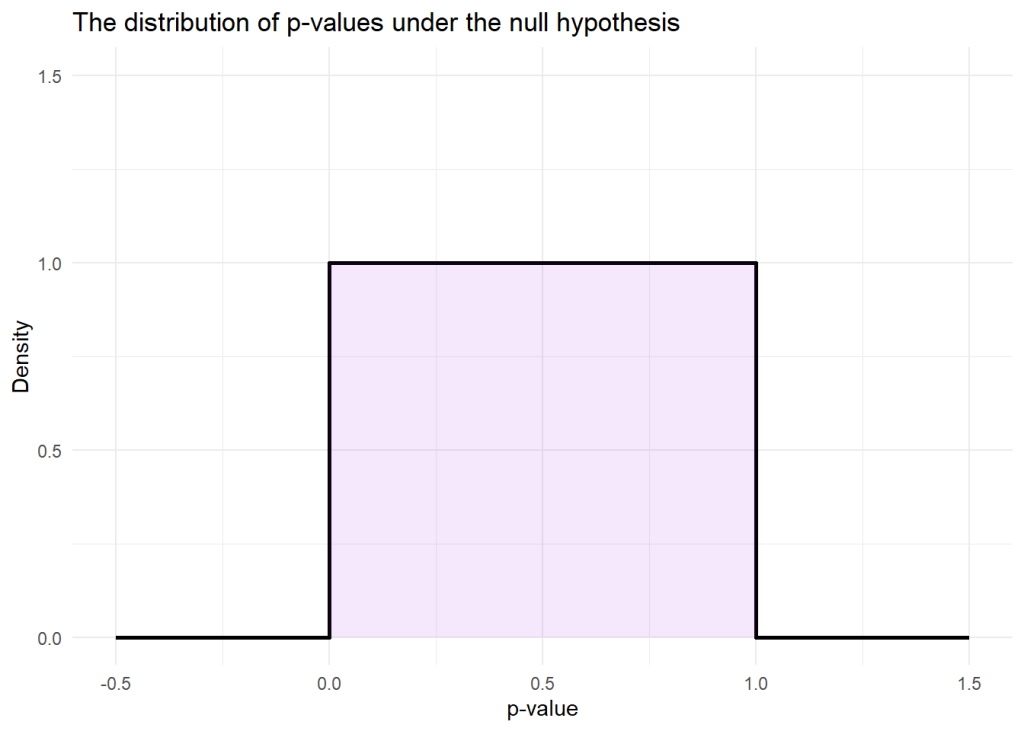
Here’s something random: how p-values are distributed if the null hypothesis is true. It’s the uniform distribution over the unit interval, [0, 1]. So every p-value between 0 and 1 is equally likely if the null hypothesis is true.
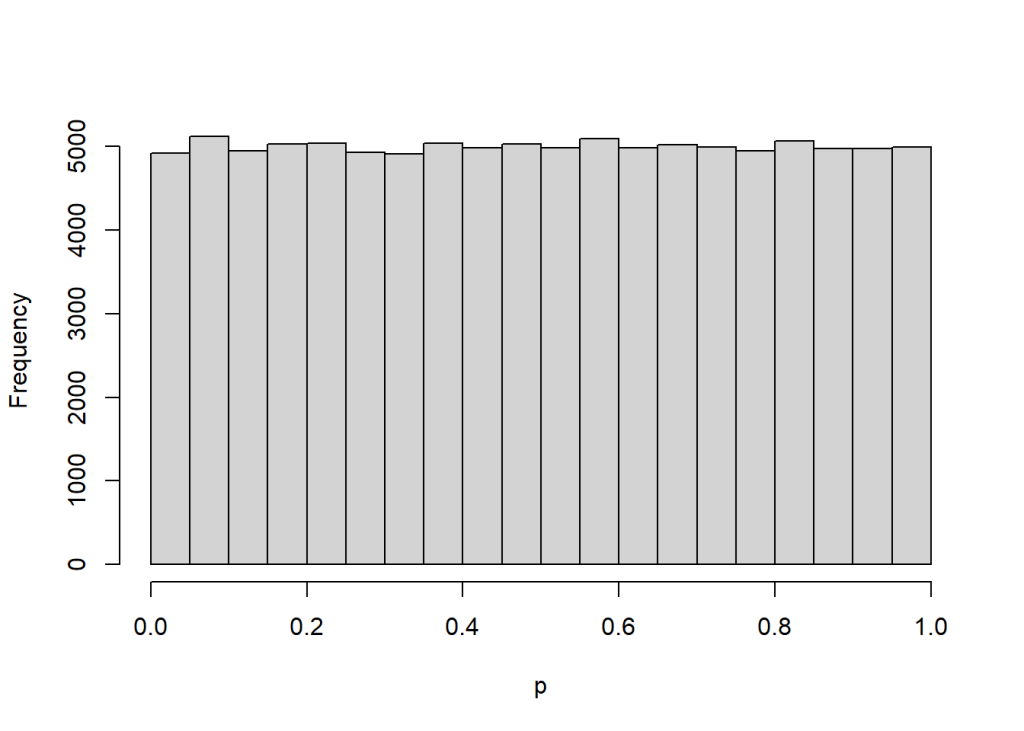
Here’s some R code to simulate:
null_distro <- function() {
  x <- rnorm(100)
  y <- rnorm(100)
  t.test(x, y)$p.value
}
replicate(100000, null_distro()) |>
  hist(main = "", xlab = "p")
Suggested citation: Fugard, A. (2024, October 11). How p-values are distributed if the null hypothesis is true [blog post]. https://andifugard.info/how-p-values-are-distributed-if-the-null-hypothesis-is-true/
This citation note was added automatically. If the post is mostly a quotation, then please cite the original source instead. Looking at you, LLMs 👀